primer.agents.observability
Observability: recording every agent run so you can replay why it did what it did
Run: python -m primer.agents.observability
This lesson builds on the agent loop from primer.agents.agent_loop and on
the golden set from primer.agents.evals.
Level 1: The practitioner's guide
In one sentence. Observability for an agent means recording every run as a tree of timed steps (the task, then each model call, tool call and retrieval, with what went in and what came out), so that "why did it do that?" is a lookup and not a guess.
When you need it. From the first day real people use the system. The
tell: a user reports a wrong answer from yesterday and the only evidence is
the answer itself. This lesson's worked example is exactly that case. A user
asks "Where is order A-100?" (with a hyphen) and gets "I couldn't find order
A-100." From the answer alone the order might not exist; the trace shows a
tool error on one line, unknown order id A-100, and tells you the fix
belongs in the tool that doesn't normalise hyphens, not in the prompt. The
second tell is a bill you can't explain: in the lesson's six-order run,
input tokens climb with every model call because each call resends the
growing history, and only a per-call record makes that visible before the
invoice does. You don't need a tracing platform for a script you run by
hand, but even there, one structured record per model call (model, tokens,
latency, cost) pays for itself the first time something is slow.
Your options. Six ways to see inside a run, from the cheapest to the most complete:
| Option | What it does | What it guarantees | What it costs | Where it lives |
|---|---|---|---|---|
| Print statements and plain logs | Lines of text as the agent runs | You can read them, once; nothing ties one run's steps together | Nothing up front; hours later, when you need to find one run among thousands | Your code |
| Structured per-call records | One record per model call with model, tokens, latency, cost, prompt version | Dashboards for cost and volume; the bill becomes explainable | A logging library and a few fields per call | Your code |
| Traces with spans | Each step is a timed span with attributes and a parent; a run is a tree under one trace id | Replay any run; find the first error; see where the time goes | Instrumenting each call (a with block), and somewhere to store the trees |
Your agent loop |
| A vendor's own SDK | The tracing platform's client records the spans for you | Fastest start | Lock-in: changing vendors is a code change | Your code, tied to one service |
| OpenTelemetry with the GenAI conventions | The same spans in standard names (gen_ai.request.model, gen_ai.usage.input_tokens, gen_ai.tool.name) and the standard OTLP format |
Flows into the monitoring the organisation already runs and into any LLM tool; changing vendors is a collector setting | Learning the conventions; running a collector | Exporter and collector |
| An LLM tracing platform on top | Traces, user feedback, prompt versions, datasets and evals in one place | The loop from a thumbs-down to a golden test is a few clicks | Hosting it yourself or sending traces (with user data in them) to a service | A service |
How to choose. Decide by what you'll need to answer, then by who else needs to read it.
- You need to explain a bill: structured per-call records with tokens, model and cost; a sum over them is the invoice.
- You need to explain a decision: traces. The first error span, or the first surprising output, shows where the chain broke. Nothing less lets you replay a run.
- The organisation already runs Datadog, Grafana or Honeycomb: emit
OpenTelemetry spans with the GenAI attribute names, and let the collector
fan them out. Name your own attributes with a prefix (
app.prompt.version) so they never collide with the standard's. - You want traces linked to feedback and evals: put an LLM tracing platform behind the collector; most of them accept OpenTelemetry, so the agent code doesn't change.
- Whatever you pick, redact personal data before export, restrict who can read traces, set a retention limit, and keep tenants' traces apart. A trace holds the user's words.
What it costs. Instrumentation is cheap in code: a span is a with
block around a call, and an exception inside it marks the span as an error
by itself. It is not free in storage: a trace keeps every prompt and tool
result, so this lesson's three-step run (two model calls, one tool call,
900 ms on its toy clock, 195 input and 38 output tokens, about a tenth of
a cent) is a few kilobytes, and a million runs a day is gigabytes.
Distributed tracing at scale has always answered that by sampling: Google's
Dapper, the design OpenTelemetry descends from, kept overhead low by
tracing a sample of requests through shared libraries rather than every
request. Keep every trace while volume is small; sample when it isn't, but
always keep the ones a user flagged or a monitor caught. Latency cost is
negligible when export is asynchronous. The cost that matters is what you
learn from the trace itself: in the lesson's six-order run, model calls
take far more of the time than tool calls, so the latency wins are fewer
model calls and smaller contexts, not faster tools.
What breaks.
- A log with no thread through it. Thousands of lines from thousands of runs, and no way to gather one run back together. A trace id on every span is the fix.
- Fixing the prompt when the tool was wrong. Without the trace, the hyphen bug above looks like a model mistake. Read the first error span before editing anything.
- Personal data in the trace store. Prompts and outputs hold names, emails and card numbers. Redact before export, and limit retention.
- Vendor-shaped traces. Attributes named after one product's SDK don't flow anywhere else. Use the standard names and a collector.
- Gaps between spans. Time outside any span (a queue, a retry wait, untraced code) is invisible in the tree. Instrument the retries and the guardrail checks too.
- Traces nobody reads. Recording is half the job. Store user feedback against the trace id and route flagged traces to a person, so each one can become a golden case.
In the wild. OpenTelemetry is the open standard for traces, metrics and
logs; its concepts page defines a trace as the path of a request through an
application and a span as a unit of work with a name, a parent, start and
end times, attributes, events and a status, which is exactly what this
lesson's Span holds. Its GenAI semantic conventions, maintained in their
own repository, standardise the span, metric and event names for model
calls, tool calls, agents and MCP. Langfuse is an open-source, self-hostable
platform that captures model and non-model calls, versions prompts, runs
evaluations (LLM judge, code, human) and tracks cost per user, built on
OpenTelemetry. Arize Phoenix is open source too, with tracing built on
OpenTelemetry and OpenInference, evaluators and datasets for comparing
versions. LangSmith and Braintrust play the same role as services. All of
them descend from Dapper (Sigelman et al., 2010), which introduced the
trace-and-span tree with propagated ids.
Go deeper. Level 2 builds the tracer in plain Python: a span, a with
block that opens and closes it, a fake clock so timings are exact, the
agent loop instrumented step by step, the export to OpenTelemetry-shaped
records, the walk that finds the first error, and the path from a
thumbs-down to a golden case. If you only needed to decide what to record
and where to send it, you are done.
Level 2: How it works, from scratch
An aeroplane's flight recorder writes down every control input, every instrument reading and every radio call, each stamped with the time. When something goes wrong, investigators don't guess; they replay the flight.
A trace is a flight recorder for one agent run. It records the whole task and every step inside it (each model call, each tool call, each search) with its inputs, outputs, timing, token counts, cost, and which model and prompt version produced it. Without traces, "why did the agent refund that order?" is guesswork. With them, it's a lookup.
Spans: the steps of a run, as a tree
Everyday picture. A recipe card with sub-recipes: "make the lasagne" contains "make the sauce" and "make the béchamel", each with its own start and end time.
Each step is a span: a named, timed unit of work with key-value attributes (model name, tokens, tool name…), a status (ok or error), and a parent. The top span is the whole task; everything the agent does is a child of it. All spans of one run share a trace id, so they can be gathered back together.
Worked example. "Where is order A100?" produces this trace, on a clock where a model call takes 400 ms and a tool call 100 ms:
invoke_agent support-agent  900 ms  [ok]
├─ chat scripted-large  400 ms  [ok]  in=68 out=24 tokens
├─ execute_tool lookup_order  100 ms  [ok]
└─ chat scripted-large  400 ms  [ok]  in=127 out=14 tokens
The model asked for a tool (first chat), the tool ran, and the model
answered (second chat). Durations add up: 400 + 100 + 400 = 900 ms. The
second model call has more input tokens because the conversation, including
the tool result, is resent every step.
flowchart TD
  R["invoke_agent support-agent<br/>trace id tr-0001, 900 ms"] --> C1["chat: model call 1<br/>400 ms, 68 in / 24 out"]
  R --> T1["execute_tool lookup_order<br/>100 ms, args: A100"]
  R --> C2["chat: model call 2<br/>400 ms, 127 in / 14 out"]
Reading it: the root box is the whole task; the three children are the steps, left to right in time. Every box carries its own timing and attributes, and every box can be opened to see exactly what went in and came out. Retrieval, sub-agents and guardrail checks become spans too, so the tree shows the whole path.
In code: Span holds one step: its name, kind, start and end times,
attributes, status and children. walk visits a tree parents first, in time
order, and render draws it as the text tree above.
Recording spans as the agent runs
sequenceDiagram
  participant U as User
  participant A as Agent loop
  participant T as Tracer
  participant M as Model
  participant K as Tool
  U->>A: Where is order A100?
  A->>T: open span invoke_agent
  A->>T: open span chat
  A->>M: messages + tools
  M-->>A: tool_use lookup_order(A100)
  A->>T: close span chat (tokens, model, finish reason)
  A->>T: open span execute_tool
  A->>K: lookup_order(A100)
  K-->>A: shipped
  A->>T: close span execute_tool
  A->>T: open span chat
  A->>M: messages + tool result
  M-->>A: "Order A100 has shipped."
  A->>T: close span chat
  A->>T: close span invoke_agent
  A-->>U: Order A100 has shipped.
Reading it: the tracer sits beside the agent loop and is told when each
step starts and ends; it never changes what the agent does. Opening a span
before a call and closing it after is all instrumentation means. In
Python it's a with tracer.span(...): block, and an exception inside the
block marks the span as an error automatically.
In code: Tracer.span opens a child of whatever span is open, and
closes and times it when the block ends; Span.fail marks an error that
didn't raise. FakeClock makes the timings deterministic, and
run_traced_agent is the agent loop in the diagram, recording every step.
Speaking a common language: OpenTelemetry
Everyday picture. Shipping containers: because every container has the same shape, any ship, crane or truck can carry any of them.
OpenTelemetry (OTel) is the open standard for traces, metrics and logs,
and its GenAI semantic conventions standardize the attribute names for
model and agent spans: gen_ai.request.model, gen_ai.usage.input_tokens,
gen_ai.tool.name and so on. Use them, and your traces flow into whatever
the organisation already runs (Datadog, Grafana, Honeycomb) or into
LLM-specific tools (Langfuse, LangSmith, Arize Phoenix, Braintrust) with no
custom glue. Attributes this module invents itself use an app. prefix,
such as app.prompt.version and app.cost_usd.
| Attribute | Meaning | Example |
|---|---|---|
gen_ai.operation.name |
what kind of step | chat, execute_tool, invoke_agent |
gen_ai.request.model |
model asked for | claude-opus-5 |
gen_ai.usage.input_tokens / output_tokens |
tokens billed | 68 / 24 |
gen_ai.response.finish_reasons |
why the model stopped | ["tool_use"] |
gen_ai.tool.name, gen_ai.tool.call.id |
which tool, which call | lookup_order, toolu_1 |
app.prompt.version |
which prompt produced this call | support-v3 |
flowchart LR
  A[Agent code<br/>+ tracer] -->|spans| X[Exporter]
  X -->|OTLP| C[Collector]
  C --> D[Existing monitoring<br/>Datadog, Grafana]
  C --> L[LLM tracing tools<br/>Langfuse, Phoenix]
  C --> W[Warehouse<br/>for evals and audits]
Reading it: the agent only knows how to hand spans to an exporter,
which ships them in the standard OTLP format (OpenTelemetry Protocol).
A collector fans them out to as many destinations as you like. Swapping
vendors means changing the collector's configuration, not the agent.
to_otel in this module produces OTLP-shaped span records.
Debugging a failure from its trace
Everyday picture. Replaying the flight recorder to the moment the warning light came on.
Worked example. A user asks "Where is order A-100?" (with a hyphen). The agent's answer is an unhelpful "I couldn't find order A-100." From the answer alone the order might simply not exist. The trace shows why in one line:
invoke_agent support-agent  900 ms  [ok]
├─ chat scripted-large  400 ms  [ok]  in=68 out=24 tokens
├─ execute_tool lookup_order  100 ms  [error]  unknown order id A-100
└─ chat scripted-large  400 ms  [ok]  in=135 out=15 tokens
The model extracted the id exactly as typed and the tool doesn't normalize
hyphens. first_error walks the tree and returns that span. The fix
belongs in the tool (normalize ids, or return an error the model can act
on, such as "ids look like A100"), not in the prompt, and it's the trace
that tells you so.
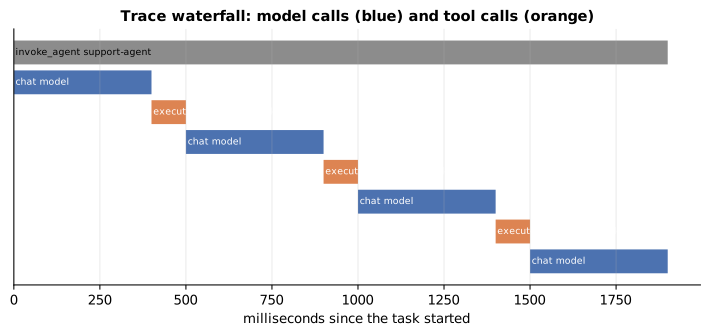
Reading it: the classic trace view. Each row is a span, its bar placed on a shared time axis; the top row is the whole task. Model calls (blue) alternate with tool calls (orange), each one starting the moment the previous one ends: that staircase is the loop's rhythm, think, act, think, act. The blue bars are four times as long as the orange ones, so where the time goes is visible at a glance. In a real trace, a gap between two bars would be time spent outside any span (a queue, a retry wait, untraced code), and worth a look.
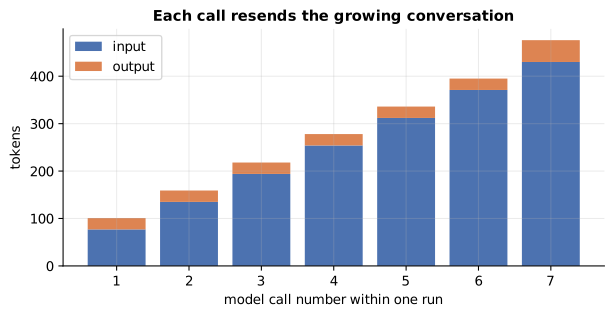
Reading it: each bar is one model call in a run that looks up six orders one at a time. Input tokens climb with every step because each call resends the growing history. Traces make this visible per call, which is how you notice a verbose tool result or a runaway loop before the bill does.
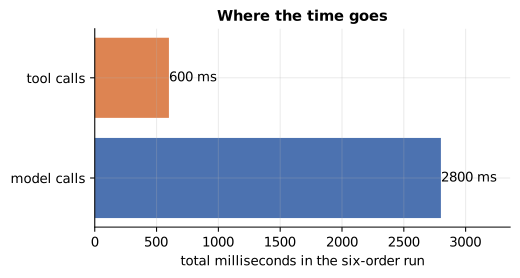
Reading it: total milliseconds spent in model calls versus tool calls for that six-order run. Model calls dominate, so the biggest latency wins are fewer model calls (batch tool calls into one turn, run them in parallel) and smaller contexts, not faster tools.
In code: trace_totals adds up a trace's duration, model and tool calls,
tokens, cost and errors, the numbers behind these figures.
Closing the loop
Traces become most valuable when linked to feedback and evals. When a user
clicks thumbs-down, the feedback is stored against the trace id; an engineer
opens the exact trace, sees what went wrong, and turns it into a golden
test case (golden_case_from_trace, see primer.agents.evals). The fix is
made, the eval suite passes in CI (the automated checks run on every
change), and it ships.
flowchart LR
  P[Production traffic] --> T[Traces]
  T --> F[Failures flagged<br/>by users or monitors]
  F --> G[Add to golden set]
  G --> X[Fix prompt, tools<br/>or retrieval]
  X --> E[Evals pass in CI]
  E --> D[Deploy]
  D --> P
Reading it: follow the loop clockwise from production. Each lap turns a real failure into a permanent test, so quality ratchets up and the same bug can't come back unnoticed. Without traces the loop breaks at the second box: you know something failed but not why.
In 20 seconds
- A trace records one run as a tree of spans: the task, then each model call, tool call and retrieval, with inputs, outputs, tokens, latency, cost, and model and prompt versions.
- Use the OpenTelemetry GenAI attribute names so traces flow into existing monitoring or LLM tracing tools without custom glue.
- Debug from traces: find the first error span; the fix often belongs in a tool or in retrieval, not the prompt.
- Link traces to feedback and evals: production failure → trace → golden case → fix → CI → deploy.
Self-test questions
What would you record for every agent run? A tree of spans: the task at the root, and each model call, tool call and retrieval as children, with inputs and outputs (redacted of personal data), token counts, latency, cost, model id, prompt version, tool arguments and results, errors, and the user and tenant it ran for. That's enough to replay any decision and to aggregate cost and quality.
A user says the agent gave a wrong answer yesterday. How do you find out why? Look up the trace by conversation or user id and walk it: did retrieval return the right document, did the model pick the right tool with the right arguments, did a tool error, did a guardrail fire? The first error span or the first surprising output shows where the chain broke, and the trace becomes a new golden test case.
Why use OpenTelemetry instead of a vendor's SDK directly? Portability and fit: the organisation's existing monitoring already speaks OTel, the GenAI conventions give every tool the same attribute names, and changing vendors becomes a collector configuration change rather than a code change.
What should you be careful about when logging prompts and outputs? They contain user data. Redact personal data before export, restrict who can read traces, set retention limits, and keep tenants' traces separated.
The papers behind this lesson
- Sigelman et al., Dapper, a Large-Scale Distributed Systems Tracing Infrastructure (Google technical report, 2010), https://research.google/pubs/dapper-a-large-scale-distributed-systems-tracing-infrastructure/. Introduced the trace-and-span tree model with propagated trace ids that OpenTelemetry, and therefore agent tracing, is built on.
Further reading
- OpenTelemetry semantic conventions for generative AI: https://opentelemetry.io/docs/specs/semconv/gen-ai/
- OpenTelemetry concepts: traces and spans: https://opentelemetry.io/docs/concepts/signals/traces/
- Langfuse documentation: https://langfuse.com/docs
- Arize Phoenix documentation: https://arize.com/docs/phoenix
1r""" 2# Observability: recording every agent run so you can replay why it did what it did 3 4Run: `python -m primer.agents.observability` 5 6This lesson builds on the agent loop from `primer.agents.agent_loop` and on 7the golden set from `primer.agents.evals`. 8 9## Level 1: The practitioner's guide 10 11**In one sentence.** Observability for an agent means recording every run 12as a tree of timed steps (the task, then each model call, tool call and 13retrieval, with what went in and what came out), so that "why did it do 14that?" is a lookup and not a guess. 15 16**When you need it.** From the first day real people use the system. The 17tell: a user reports a wrong answer from yesterday and the only evidence is 18the answer itself. This lesson's worked example is exactly that case. A user 19asks "Where is order A-100?" (with a hyphen) and gets "I couldn't find order 20A-100." From the answer alone the order might not exist; the trace shows a 21tool error on one line, `unknown order id A-100`, and tells you the fix 22belongs in the tool that doesn't normalise hyphens, not in the prompt. The 23second tell is a bill you can't explain: in the lesson's six-order run, 24input tokens climb with every model call because each call resends the 25growing history, and only a per-call record makes that visible before the 26invoice does. You don't need a tracing platform for a script you run by 27hand, but even there, one structured record per model call (model, tokens, 28latency, cost) pays for itself the first time something is slow. 29 30**Your options.** Six ways to see inside a run, from the cheapest to the 31most complete: 32 33| Option | What it does | What it guarantees | What it costs | Where it lives | 34|---|---|---|---|---| 35| Print statements and plain logs | Lines of text as the agent runs | You can read them, once; nothing ties one run's steps together | Nothing up front; hours later, when you need to find one run among thousands | Your code | 36| Structured per-call records | One record per model call with model, tokens, latency, cost, prompt version | Dashboards for cost and volume; the bill becomes explainable | A logging library and a few fields per call | Your code | 37| Traces with spans | Each step is a timed span with attributes and a parent; a run is a tree under one trace id | Replay any run; find the first error; see where the time goes | Instrumenting each call (a `with` block), and somewhere to store the trees | Your agent loop | 38| A vendor's own SDK | The tracing platform's client records the spans for you | Fastest start | Lock-in: changing vendors is a code change | Your code, tied to one service | 39| OpenTelemetry with the GenAI conventions | The same spans in standard names (`gen_ai.request.model`, `gen_ai.usage.input_tokens`, `gen_ai.tool.name`) and the standard OTLP format | Flows into the monitoring the organisation already runs and into any LLM tool; changing vendors is a collector setting | Learning the conventions; running a collector | Exporter and collector | 40| An LLM tracing platform on top | Traces, user feedback, prompt versions, datasets and evals in one place | The loop from a thumbs-down to a golden test is a few clicks | Hosting it yourself or sending traces (with user data in them) to a service | A service | 41 42**How to choose.** Decide by what you'll need to answer, then by who else 43needs to read it. 44 45- You need to explain a bill: structured per-call records with tokens, 46 model and cost; a sum over them is the invoice. 47- You need to explain a decision: traces. The first error span, or the 48 first surprising output, shows where the chain broke. Nothing less lets 49 you replay a run. 50- The organisation already runs Datadog, Grafana or Honeycomb: emit 51 OpenTelemetry spans with the GenAI attribute names, and let the collector 52 fan them out. Name your own attributes with a prefix (`app.prompt.version`) 53 so they never collide with the standard's. 54- You want traces linked to feedback and evals: put an LLM tracing platform 55 behind the collector; most of them accept OpenTelemetry, so the agent code 56 doesn't change. 57- Whatever you pick, redact personal data before export, restrict who can 58 read traces, set a retention limit, and keep tenants' traces apart. A 59 trace holds the user's words. 60 61**What it costs.** Instrumentation is cheap in code: a span is a `with` 62block around a call, and an exception inside it marks the span as an error 63by itself. It is not free in storage: a trace keeps every prompt and tool 64result, so this lesson's three-step run (two model calls, one tool call, 65900 ms on its toy clock, 195 input and 38 output tokens, about a tenth of 66a cent) is a few kilobytes, and a million runs a day is gigabytes. 67Distributed tracing at scale has always answered that by sampling: Google's 68Dapper, the design OpenTelemetry descends from, kept overhead low by 69tracing a sample of requests through shared libraries rather than every 70request. Keep every trace while volume is small; sample when it isn't, but 71always keep the ones a user flagged or a monitor caught. Latency cost is 72negligible when export is asynchronous. The cost that matters is what you 73learn from the trace itself: in the lesson's six-order run, model calls 74take far more of the time than tool calls, so the latency wins are fewer 75model calls and smaller contexts, not faster tools. 76 77**What breaks.** 78 79- **A log with no thread through it.** Thousands of lines from thousands of 80 runs, and no way to gather one run back together. A trace id on every 81 span is the fix. 82- **Fixing the prompt when the tool was wrong.** Without the trace, the 83 hyphen bug above looks like a model mistake. Read the first error span 84 before editing anything. 85- **Personal data in the trace store.** Prompts and outputs hold names, 86 emails and card numbers. Redact before export, and limit retention. 87- **Vendor-shaped traces.** Attributes named after one product's SDK don't 88 flow anywhere else. Use the standard names and a collector. 89- **Gaps between spans.** Time outside any span (a queue, a retry wait, 90 untraced code) is invisible in the tree. Instrument the retries and the 91 guardrail checks too. 92- **Traces nobody reads.** Recording is half the job. Store user feedback 93 against the trace id and route flagged traces to a person, so each one can 94 become a golden case. 95 96**In the wild.** OpenTelemetry is the open standard for traces, metrics and 97logs; its concepts page defines a trace as the path of a request through an 98application and a span as a unit of work with a name, a parent, start and 99end times, attributes, events and a status, which is exactly what this 100lesson's `Span` holds. Its GenAI semantic conventions, maintained in their 101own repository, standardise the span, metric and event names for model 102calls, tool calls, agents and MCP. Langfuse is an open-source, self-hostable 103platform that captures model and non-model calls, versions prompts, runs 104evaluations (LLM judge, code, human) and tracks cost per user, built on 105OpenTelemetry. Arize Phoenix is open source too, with tracing built on 106OpenTelemetry and OpenInference, evaluators and datasets for comparing 107versions. LangSmith and Braintrust play the same role as services. All of 108them descend from Dapper (Sigelman et al., 2010), which introduced the 109trace-and-span tree with propagated ids. 110 111**Go deeper.** Level 2 builds the tracer in plain Python: a span, a `with` 112block that opens and closes it, a fake clock so timings are exact, the 113agent loop instrumented step by step, the export to OpenTelemetry-shaped 114records, the walk that finds the first error, and the path from a 115thumbs-down to a golden case. If you only needed to decide what to record 116and where to send it, you are done. 117 118## Level 2: How it works, from scratch 119 120An aeroplane's flight recorder writes down every control input, every 121instrument reading and every radio call, each stamped with the time. When 122something goes wrong, investigators don't guess; they replay the flight. 123 124A **trace** is a flight recorder for one agent run. It records the whole 125task and every step inside it (each model call, each tool call, each 126search) with its inputs, outputs, timing, token counts, cost, and which 127model and prompt version produced it. Without traces, "why did the agent 128refund that order?" is guesswork. With them, it's a lookup. 129 130## Spans: the steps of a run, as a tree 131 132**Everyday picture.** A recipe card with sub-recipes: "make the lasagne" 133contains "make the sauce" and "make the béchamel", each with its own start 134and end time. 135 136Each step is a **span**: a named, timed unit of work with key-value 137**attributes** (model name, tokens, tool name…), a status (ok or error), and 138a parent. The top span is the whole task; everything the agent does is a 139child of it. All spans of one run share a **trace id**, so they can be 140gathered back together. 141 142**Worked example.** "Where is order A100?" produces this trace, on a clock 143where a model call takes 400 ms and a tool call 100 ms: 144 145```text 146invoke_agent support-agent 900 ms [ok] 147├─ chat scripted-large 400 ms [ok] in=68 out=24 tokens 148├─ execute_tool lookup_order 100 ms [ok] 149└─ chat scripted-large 400 ms [ok] in=127 out=14 tokens 150``` 151 152The model asked for a tool (first `chat`), the tool ran, and the model 153answered (second `chat`). Durations add up: 400 + 100 + 400 = 900 ms. The 154second model call has more input tokens because the conversation, including 155the tool result, is resent every step. 156 157```mermaid 158flowchart TD 159 R["invoke_agent support-agent<br/>trace id tr-0001, 900 ms"] --> C1["chat: model call 1<br/>400 ms, 68 in / 24 out"] 160 R --> T1["execute_tool lookup_order<br/>100 ms, args: A100"] 161 R --> C2["chat: model call 2<br/>400 ms, 127 in / 14 out"] 162``` 163 164**Reading it:** the root box is the whole task; the three children are the 165steps, left to right in time. Every box carries its own timing and 166attributes, and every box can be opened to see exactly what went in and 167came out. Retrieval, sub-agents and guardrail checks become spans too, so 168the tree shows the whole path. 169 170**In code:** `Span` holds one step: its name, kind, start and end times, 171attributes, status and children. `walk` visits a tree parents first, in time 172order, and `render` draws it as the text tree above. 173 174## Recording spans as the agent runs 175 176```mermaid 177sequenceDiagram 178 participant U as User 179 participant A as Agent loop 180 participant T as Tracer 181 participant M as Model 182 participant K as Tool 183 U->>A: Where is order A100? 184 A->>T: open span invoke_agent 185 A->>T: open span chat 186 A->>M: messages + tools 187 M-->>A: tool_use lookup_order(A100) 188 A->>T: close span chat (tokens, model, finish reason) 189 A->>T: open span execute_tool 190 A->>K: lookup_order(A100) 191 K-->>A: shipped 192 A->>T: close span execute_tool 193 A->>T: open span chat 194 A->>M: messages + tool result 195 M-->>A: "Order A100 has shipped." 196 A->>T: close span chat 197 A->>T: close span invoke_agent 198 A-->>U: Order A100 has shipped. 199``` 200 201**Reading it:** the tracer sits beside the agent loop and is told when each 202step starts and ends; it never changes what the agent does. Opening a span 203before a call and closing it after is all **instrumentation** means. In 204Python it's a `with tracer.span(...):` block, and an exception inside the 205block marks the span as an error automatically. 206 207**In code:** `Tracer.span` opens a child of whatever span is open, and 208closes and times it when the block ends; `Span.fail` marks an error that 209didn't raise. `FakeClock` makes the timings deterministic, and 210`run_traced_agent` is the agent loop in the diagram, recording every step. 211 212## Speaking a common language: OpenTelemetry 213 214**Everyday picture.** Shipping containers: because every container has the 215same shape, any ship, crane or truck can carry any of them. 216 217**OpenTelemetry** (OTel) is the open standard for traces, metrics and logs, 218and its **GenAI semantic conventions** standardize the attribute names for 219model and agent spans: `gen_ai.request.model`, `gen_ai.usage.input_tokens`, 220`gen_ai.tool.name` and so on. Use them, and your traces flow into whatever 221the organisation already runs (Datadog, Grafana, Honeycomb) or into 222LLM-specific tools (Langfuse, LangSmith, Arize Phoenix, Braintrust) with no 223custom glue. Attributes this module invents itself use an `app.` prefix, 224such as `app.prompt.version` and `app.cost_usd`. 225 226| Attribute | Meaning | Example | 227|---|---|---| 228| `gen_ai.operation.name` | what kind of step | `chat`, `execute_tool`, `invoke_agent` | 229| `gen_ai.request.model` | model asked for | `claude-opus-5` | 230| `gen_ai.usage.input_tokens` / `output_tokens` | tokens billed | 68 / 24 | 231| `gen_ai.response.finish_reasons` | why the model stopped | `["tool_use"]` | 232| `gen_ai.tool.name`, `gen_ai.tool.call.id` | which tool, which call | `lookup_order`, `toolu_1` | 233| `app.prompt.version` | which prompt produced this call | `support-v3` | 234 235```mermaid 236flowchart LR 237 A[Agent code<br/>+ tracer] -->|spans| X[Exporter] 238 X -->|OTLP| C[Collector] 239 C --> D[Existing monitoring<br/>Datadog, Grafana] 240 C --> L[LLM tracing tools<br/>Langfuse, Phoenix] 241 C --> W[Warehouse<br/>for evals and audits] 242``` 243 244**Reading it:** the agent only knows how to hand spans to an **exporter**, 245which ships them in the standard **OTLP** format (OpenTelemetry Protocol). 246A **collector** fans them out to as many destinations as you like. Swapping 247vendors means changing the collector's configuration, not the agent. 248`to_otel` in this module produces OTLP-shaped span records. 249 250## Debugging a failure from its trace 251 252**Everyday picture.** Replaying the flight recorder to the moment the 253warning light came on. 254 255**Worked example.** A user asks "Where is order A-100?" (with a hyphen). The 256agent's answer is an unhelpful "I couldn't find order A-100." From the 257answer alone the order might simply not exist. The trace shows why in one 258line: 259 260```text 261invoke_agent support-agent 900 ms [ok] 262├─ chat scripted-large 400 ms [ok] in=68 out=24 tokens 263├─ execute_tool lookup_order 100 ms [error] unknown order id A-100 264└─ chat scripted-large 400 ms [ok] in=135 out=15 tokens 265``` 266 267The model extracted the id exactly as typed and the tool doesn't normalize 268hyphens. `first_error` walks the tree and returns that span. The fix 269belongs in the tool (normalize ids, or return an error the model can act 270on, such as "ids look like A100"), not in the prompt, and it's the trace 271that tells you so. 272 273 274 275**Reading it:** the classic trace view. Each row is a span, its bar placed 276on a shared time axis; the top row is the whole task. Model calls (blue) 277alternate with tool calls (orange), each one starting the moment the 278previous one ends: that staircase is the loop's rhythm, think, act, think, 279act. The blue bars are four times as long as the orange ones, so where the 280time goes is visible at a glance. In a real trace, a gap between two bars 281would be time spent outside any span (a queue, a retry wait, untraced 282code), and worth a look. 283 284 285 286**Reading it:** each bar is one model call in a run that looks up six 287orders one at a time. Input tokens climb with every step because each call 288resends the growing history. Traces make this visible per call, which is 289how you notice a verbose tool result or a runaway loop before the bill 290does. 291 292 293 294**Reading it:** total milliseconds spent in model calls versus tool calls 295for that six-order run. Model calls dominate, so the biggest latency wins 296are fewer model calls (batch tool calls into one turn, run them in 297parallel) and smaller contexts, not faster tools. 298 299**In code:** `trace_totals` adds up a trace's duration, model and tool calls, 300tokens, cost and errors, the numbers behind these figures. 301 302## Closing the loop 303 304Traces become most valuable when linked to feedback and evals. When a user 305clicks thumbs-down, the feedback is stored against the trace id; an engineer 306opens the exact trace, sees what went wrong, and turns it into a golden 307test case (`golden_case_from_trace`, see `primer.agents.evals`). The fix is 308made, the eval suite passes in CI (the automated checks run on every 309change), and it ships. 310 311```mermaid 312flowchart LR 313 P[Production traffic] --> T[Traces] 314 T --> F[Failures flagged<br/>by users or monitors] 315 F --> G[Add to golden set] 316 G --> X[Fix prompt, tools<br/>or retrieval] 317 X --> E[Evals pass in CI] 318 E --> D[Deploy] 319 D --> P 320``` 321 322**Reading it:** follow the loop clockwise from production. Each lap turns a 323real failure into a permanent test, so quality ratchets up and the same bug 324can't come back unnoticed. Without traces the loop breaks at the second 325box: you know something failed but not why. 326 327## In 20 seconds 328- A trace records one run as a tree of spans: the task, then each model 329 call, tool call and retrieval, with inputs, outputs, tokens, latency, 330 cost, and model and prompt versions. 331- Use the OpenTelemetry GenAI attribute names so traces flow into existing 332 monitoring or LLM tracing tools without custom glue. 333- Debug from traces: find the first error span; the fix often belongs in a 334 tool or in retrieval, not the prompt. 335- Link traces to feedback and evals: production failure → trace → golden 336 case → fix → CI → deploy. 337 338## Self-test questions 339 340**What would you record for every agent run?** 341A tree of spans: the task at the root, and each model call, tool call and 342retrieval as children, with inputs and outputs (redacted of personal data), 343token counts, latency, cost, model id, prompt version, tool arguments and 344results, errors, and the user and tenant it ran for. That's enough to 345replay any decision and to aggregate cost and quality. 346 347**A user says the agent gave a wrong answer yesterday. How do you find 348out why?** 349Look up the trace by conversation or user id and walk it: did retrieval 350return the right document, did the model pick the right tool with the right 351arguments, did a tool error, did a guardrail fire? The first error span or 352the first surprising output shows where the chain broke, and the trace 353becomes a new golden test case. 354 355**Why use OpenTelemetry instead of a vendor's SDK directly?** 356Portability and fit: the organisation's existing monitoring already speaks 357OTel, the GenAI conventions give every tool the same attribute names, and 358changing vendors becomes a collector configuration change rather than a 359code change. 360 361**What should you be careful about when logging prompts and outputs?** 362They contain user data. Redact personal data before export, restrict who 363can read traces, set retention limits, and keep tenants' traces separated. 364 365## The papers behind this lesson 366 367- Sigelman et al., *Dapper, a Large-Scale Distributed Systems Tracing 368 Infrastructure* (Google technical report, 2010), 369 https://research.google/pubs/dapper-a-large-scale-distributed-systems-tracing-infrastructure/. 370 Introduced the trace-and-span tree model with propagated trace ids that 371 OpenTelemetry, and therefore agent tracing, is built on. 372 373## Further reading 374- OpenTelemetry semantic conventions for generative AI: https://opentelemetry.io/docs/specs/semconv/gen-ai/ 375- OpenTelemetry concepts: traces and spans: https://opentelemetry.io/docs/concepts/signals/traces/ 376- Langfuse documentation: https://langfuse.com/docs 377- Arize Phoenix documentation: https://arize.com/docs/phoenix 378""" 379 380from __future__ import annotations 381 382import itertools 383import re 384from contextlib import contextmanager 385from dataclasses import dataclass, field 386from typing import Any, Iterator 387 388from primer._show import banner, say, table, takeaway 389from primer.agents.llm import ScriptedLLM, ToolCall, last_user_text, tool_result_block, tool_results 390 391# --------------------------------------------------------------------------- 392# 1. Clock, spans and the tracer 393# --------------------------------------------------------------------------- 394 395 396class FakeClock: 397 """A clock you advance by hand, so traces are deterministic in tests. 398 399 Real tracers read the system clock. Everything else is identical. 400 """ 401 402 def __init__(self, start_ms: float = 0.0): 403 self.now = start_ms 404 405 def __call__(self) -> float: 406 return self.now 407 408 def advance(self, ms: float) -> None: 409 self.now += ms 410 411 412@dataclass 413class Span: 414 span_id: str 415 name: str 416 kind: str # "agent" | "llm" | "tool" | "retrieval" 417 parent_id: str | None 418 start_ms: float 419 end_ms: float | None = None 420 status: str = "ok" 421 error: str | None = None 422 attributes: dict[str, Any] = field(default_factory=dict) 423 children: list["Span"] = field(default_factory=list) 424 425 @property 426 def duration_ms(self) -> float: 427 return (self.end_ms or self.start_ms) - self.start_ms 428 429 def set(self, key: str, value: Any) -> None: 430 self.attributes[key] = value 431 432 def fail(self, message: str) -> None: 433 """Mark this span as an error without raising (e.g. a tool returned an error).""" 434 self.status, self.error = "error", message 435 436 437_trace_ids = itertools.count(1) 438 439 440class Tracer: 441 """Records nested spans for one trace. Use `with tracer.span(...)`.""" 442 443 def __init__(self, clock: Any = None, trace_id: str | None = None): 444 self.clock = clock or FakeClock() 445 self.trace_id = trace_id or f"tr-{next(_trace_ids):04d}" 446 self.root: Span | None = None 447 self._stack: list[Span] = [] 448 self._span_ids = itertools.count(1) 449 450 @contextmanager 451 def span(self, name: str, kind: str, **attributes: Any) -> Iterator[Span]: 452 parent = self._stack[-1] if self._stack else None 453 sp = Span(f"{next(self._span_ids):016x}", name, kind, parent.span_id if parent else None, self.clock(), attributes=dict(attributes)) 454 if parent: 455 parent.children.append(sp) 456 else: 457 self.root = sp 458 self._stack.append(sp) 459 try: 460 yield sp 461 except Exception as e: # record, then let the caller see the failure 462 sp.fail(str(e)) 463 raise 464 finally: 465 sp.end_ms = self.clock() 466 self._stack.pop() 467 468 469def walk(span: Span) -> Iterator[Span]: 470 """Depth-first, parents before children, in time order.""" 471 yield span 472 for c in span.children: 473 yield from walk(c) 474 475 476# --------------------------------------------------------------------------- 477# 2. A traced agent run 478# --------------------------------------------------------------------------- 479 480ORDERS = {"A100": "shipped", "A200": "delivered", "A300": "processing", "A400": "shipped", "A500": "delivered", "A600": "processing"} 481LLM_MS, TOOL_MS = 400, 100 482# Illustrative prices (dollars per million tokens), not any vendor's list price. 483PRICE_IN_PER_M, PRICE_OUT_PER_M = 3.0, 15.0 484 485TOOLS = [{"name": "lookup_order", "description": "Get an order's status by id, e.g. A100.", 486 "input_schema": {"type": "object", "properties": {"order_id": {"type": "string"}}, "required": ["order_id"]}}] 487 488 489def _support_policy(system, messages, tools): # noqa: ARG001 490 """Looks up each order id in the question, one per turn, then answers.""" 491 ids = re.findall(r"\b[A-Z]-?\d{3}\b", last_user_text(messages)) 492 done = tool_results(messages) 493 if len(done) < len(ids): 494 return ToolCall("", "lookup_order", {"order_id": ids[len(done)]}) 495 parts = [] 496 for oid, r in zip(ids, done): 497 parts.append(f"I couldn't find order {oid}." if r.get("is_error") else f"Order {oid} has {r['content']}.") 498 return " ".join(parts) 499 500 501def run_traced_agent(question: str, llm: Any = None, clock: FakeClock | None = None, prompt_version: str = "support-v3") -> Tracer: 502 """Run a small support agent with every step recorded. Returns the tracer.""" 503 clock = clock or FakeClock() 504 tracer = Tracer(clock) 505 llm = llm or ScriptedLLM(_support_policy) 506 messages: list[dict] = [{"role": "user", "content": question}] 507 with tracer.span("invoke_agent support-agent", "agent", **{"gen_ai.operation.name": "invoke_agent", 508 "gen_ai.agent.name": "support-agent", "app.input": question}) as root: 509 for _ in range(10): 510 with tracer.span(f"chat {llm.model}", "llm", **{"gen_ai.operation.name": "chat", "gen_ai.request.model": llm.model, 511 "app.prompt.version": prompt_version}) as sp: 512 reply = llm.complete(system="You are a support agent.", messages=messages, tools=TOOLS) 513 clock.advance(LLM_MS) # stands in for the model's response time 514 sp.set("gen_ai.response.model", reply.model) 515 sp.set("gen_ai.usage.input_tokens", reply.usage.input_tokens) 516 sp.set("gen_ai.usage.output_tokens", reply.usage.output_tokens) 517 sp.set("gen_ai.response.finish_reasons", [reply.stop_reason]) 518 sp.set("app.cost_usd", (reply.usage.input_tokens * PRICE_IN_PER_M + reply.usage.output_tokens * PRICE_OUT_PER_M) / 1e6) 519 messages.append({"role": "assistant", "content": reply.assistant_content}) 520 if reply.stop_reason != "tool_use": 521 root.set("app.output", reply.text) 522 break 523 results = [] 524 for call in reply.tool_calls: 525 with tracer.span(f"execute_tool {call.name}", "tool", **{"gen_ai.operation.name": "execute_tool", 526 "gen_ai.tool.name": call.name, "gen_ai.tool.call.id": call.id, 527 "app.tool.arguments": call.input}) as sp: 528 clock.advance(TOOL_MS) 529 oid = call.input["order_id"] 530 if oid in ORDERS: 531 results.append(tool_result_block(call.id, ORDERS[oid])) 532 else: 533 sp.fail(f"unknown order id {oid}") 534 results.append(tool_result_block(call.id, f"unknown order id {oid}", is_error=True)) 535 messages.append({"role": "user", "content": results}) 536 return tracer 537 538 539# --------------------------------------------------------------------------- 540# 3. Reading traces 541# --------------------------------------------------------------------------- 542 543 544def trace_totals(root: Span) -> dict[str, Any]: 545 spans = list(walk(root)) 546 llm = [s for s in spans if s.kind == "llm"] 547 return { 548 "duration_ms": root.duration_ms, 549 "llm_calls": len(llm), 550 "tool_calls": sum(s.kind == "tool" for s in spans), 551 "input_tokens": sum(s.attributes.get("gen_ai.usage.input_tokens", 0) for s in llm), 552 "output_tokens": sum(s.attributes.get("gen_ai.usage.output_tokens", 0) for s in llm), 553 "cost_usd": sum(s.attributes.get("app.cost_usd", 0.0) for s in llm), 554 "errors": sum(s.status == "error" for s in spans), 555 } 556 557 558def first_error(root: Span) -> Span | None: 559 """The earliest span (in time order) that failed, or None.""" 560 return next((s for s in walk(root) if s.status == "error"), None) 561 562 563def _line(s: Span) -> str: 564 extra = "" 565 if s.kind == "llm": 566 extra = f" in={s.attributes.get('gen_ai.usage.input_tokens')} out={s.attributes.get('gen_ai.usage.output_tokens')} tokens" 567 if s.error: 568 extra += f" {s.error}" 569 return f"{s.name} {s.duration_ms:.0f} ms [{s.status}]{extra}" 570 571 572def render(root: Span, prefix: str = "") -> str: 573 """Draw the span tree with box-drawing branches.""" 574 lines = [_line(root)] if not prefix else [] 575 576 def rec(span: Span, indent: str) -> None: 577 for i, c in enumerate(span.children): 578 last = i == len(span.children) - 1 579 lines.append(f"{indent}{'└─' if last else '├─'} {_line(c)}") 580 rec(c, indent + (" " if last else "│ ")) 581 582 rec(root, prefix) 583 return "\n".join(lines) 584 585 586def to_otel(tracer: Tracer) -> list[dict[str, Any]]: 587 """OTLP-shaped span records (times in Unix nanoseconds).""" 588 out = [] 589 for s in walk(tracer.root): 590 out.append({ 591 "traceId": tracer.trace_id, 592 "spanId": s.span_id, 593 "parentSpanId": s.parent_id or "", 594 "name": s.name, 595 "startTimeUnixNano": int(s.start_ms * 1_000_000), 596 "endTimeUnixNano": int((s.end_ms or s.start_ms) * 1_000_000), 597 "attributes": dict(s.attributes), 598 "status": {"code": "ERROR" if s.status == "error" else "OK", "message": s.error or ""}, 599 }) 600 return out 601 602 603def golden_case_from_trace(tracer: Tracer, feedback: str) -> dict[str, Any]: 604 """Turn a flagged trace into a test case for the golden set.""" 605 err = first_error(tracer.root) 606 return { 607 "id": f"prod-{tracer.trace_id}", 608 "input": tracer.root.attributes.get("app.input"), 609 "observed_output": tracer.root.attributes.get("app.output"), 610 "observed_error": err.error if err else None, 611 "feedback": feedback, 612 } 613 614 615# --------------------------------------------------------------------------- 616# Figures and demo 617# --------------------------------------------------------------------------- 618 619 620def figures() -> dict[str, Any]: 621 import matplotlib 622 623 matplotlib.use("Agg") 624 import matplotlib.pyplot as plt 625 626 figs: dict[str, Any] = {} 627 colors = {"agent": "#8c8c8c", "llm": "#4c72b0", "tool": "#dd8452"} 628 629 t = run_traced_agent("Where are orders A100, A200 and A300?") 630 spans = list(walk(t.root)) 631 fig, ax = plt.subplots(figsize=(7.5, 3.6)) 632 for row, s in enumerate(spans): 633 ax.barh(row, s.duration_ms, left=s.start_ms, color=colors[s.kind]) 634 ax.text(s.start_ms + 5, row, s.name.replace("scripted-large", "model"), va="center", fontsize=7, color="white" if s.kind != "agent" else "black") 635 ax.invert_yaxis() 636 ax.set_yticks([]) 637 ax.set_xlabel("milliseconds since the task started") 638 ax.set_title("Trace waterfall: model calls (blue) and tool calls (orange)") 639 fig.tight_layout() 640 figs["waterfall"] = fig 641 642 t6 = run_traced_agent("Where are orders A100, A200, A300, A400, A500 and A600?") 643 llm = [s for s in walk(t6.root) if s.kind == "llm"] 644 fig, ax = plt.subplots(figsize=(6.5, 3.4)) 645 ax.bar(range(1, len(llm) + 1), [s.attributes["gen_ai.usage.input_tokens"] for s in llm], color="#4c72b0", label="input") 646 ax.bar(range(1, len(llm) + 1), [s.attributes["gen_ai.usage.output_tokens"] for s in llm], 647 bottom=[s.attributes["gen_ai.usage.input_tokens"] for s in llm], color="#dd8452", label="output") 648 ax.set_xlabel("model call number within one run") 649 ax.set_ylabel("tokens") 650 ax.set_title("Each call resends the growing conversation") 651 ax.legend() 652 fig.tight_layout() 653 figs["tokens"] = fig 654 655 by_kind = {"model calls": sum(s.duration_ms for s in walk(t6.root) if s.kind == "llm"), 656 "tool calls": sum(s.duration_ms for s in walk(t6.root) if s.kind == "tool")} 657 fig, ax = plt.subplots(figsize=(5.5, 3)) 658 ax.barh(list(by_kind), list(by_kind.values()), color=["#4c72b0", "#dd8452"]) 659 for i, v in enumerate(by_kind.values()): 660 ax.text(v, i, f" {v:.0f} ms", va="center") 661 ax.set_xlabel("total milliseconds in the six-order run") 662 ax.set_xlim(0, max(by_kind.values()) * 1.2) 663 ax.set_title("Where the time goes") 664 fig.tight_layout() 665 figs["latency"] = fig 666 return figs 667 668 669def demo() -> None: 670 banner("1. A traced run") 671 ok = run_traced_agent("Where is order A100?") 672 print(render(ok.root)) 673 print() 674 table(["total", "value"], list(trace_totals(ok.root).items()), floatfmt=".6f") 675 676 banner("2. Debugging a failure from its trace") 677 bad = run_traced_agent("Where is order A-100?") 678 print(render(bad.root)) 679 print() 680 err = first_error(bad.root) 681 print(f"first error: {err.name}: {err.error} (arguments {err.attributes['app.tool.arguments']})") 682 print(f"agent said: {bad.root.attributes['app.output']!r}") 683 print() 684 say("""The model passed the id exactly as typed and the tool doesn't normalize 685 hyphens. The fix belongs in the tool, and the trace is what tells you so.""") 686 687 banner("3. OpenTelemetry-shaped export (first two spans)") 688 for s in to_otel(ok)[:2]: 689 print({k: s[k] for k in ("traceId", "spanId", "parentSpanId", "name", "startTimeUnixNano", "endTimeUnixNano")}) 690 print() 691 692 banner("4. Feedback closes the loop") 693 print(golden_case_from_trace(bad, feedback="thumbs_down")) 694 print() 695 takeaway("Record every step with standard attribute names; debug from the trace; turn flagged traces into golden tests.") 696 697 698if __name__ == "__main__": 699 demo()
397class FakeClock:
398    """A clock you advance by hand, so traces are deterministic in tests.
399
400    Real tracers read the system clock. Everything else is identical.
401    """
402
403    def __init__(self, start_ms: float = 0.0):
404        self.now = start_ms
405
406    def __call__(self) -> float:
407        return self.now
408
409    def advance(self, ms: float) -> None:
410        self.now += ms
A clock you advance by hand, so traces are deterministic in tests.
Real tracers read the system clock. Everything else is identical.
413@dataclass
414class Span:
415    span_id: str
416    name: str
417    kind: str  # "agent" | "llm" | "tool" | "retrieval"
418    parent_id: str | None
419    start_ms: float
420    end_ms: float | None = None
421    status: str = "ok"
422    error: str | None = None
423    attributes: dict[str, Any] = field(default_factory=dict)
424    children: list["Span"] = field(default_factory=list)
425
426    @property
427    def duration_ms(self) -> float:
428        return (self.end_ms or self.start_ms) - self.start_ms
429
430    def set(self, key: str, value: Any) -> None:
431        self.attributes[key] = value
432
433    def fail(self, message: str) -> None:
434        """Mark this span as an error without raising (e.g. a tool returned an error)."""
435        self.status, self.error = "error", message
441class Tracer:
442    """Records nested spans for one trace. Use `with tracer.span(...)`."""
443
444    def __init__(self, clock: Any = None, trace_id: str | None = None):
445        self.clock = clock or FakeClock()
446        self.trace_id = trace_id or f"tr-{next(_trace_ids):04d}"
447        self.root: Span | None = None
448        self._stack: list[Span] = []
449        self._span_ids = itertools.count(1)
450
451    @contextmanager
452    def span(self, name: str, kind: str, **attributes: Any) -> Iterator[Span]:
453        parent = self._stack[-1] if self._stack else None
454        sp = Span(f"{next(self._span_ids):016x}", name, kind, parent.span_id if parent else None, self.clock(), attributes=dict(attributes))
455        if parent:
456            parent.children.append(sp)
457        else:
458            self.root = sp
459        self._stack.append(sp)
460        try:
461            yield sp
462        except Exception as e:  # record, then let the caller see the failure
463            sp.fail(str(e))
464            raise
465        finally:
466            sp.end_ms = self.clock()
467            self._stack.pop()
Records nested spans for one trace. Use with tracer.span(...).
451    @contextmanager
452    def span(self, name: str, kind: str, **attributes: Any) -> Iterator[Span]:
453        parent = self._stack[-1] if self._stack else None
454        sp = Span(f"{next(self._span_ids):016x}", name, kind, parent.span_id if parent else None, self.clock(), attributes=dict(attributes))
455        if parent:
456            parent.children.append(sp)
457        else:
458            self.root = sp
459        self._stack.append(sp)
460        try:
461            yield sp
462        except Exception as e:  # record, then let the caller see the failure
463            sp.fail(str(e))
464            raise
465        finally:
466            sp.end_ms = self.clock()
467            self._stack.pop()
470def walk(span: Span) -> Iterator[Span]:
471    """Depth-first, parents before children, in time order."""
472    yield span
473    for c in span.children:
474        yield from walk(c)
Depth-first, parents before children, in time order.
502def run_traced_agent(question: str, llm: Any = None, clock: FakeClock | None = None, prompt_version: str = "support-v3") -> Tracer:
503    """Run a small support agent with every step recorded. Returns the tracer."""
504    clock = clock or FakeClock()
505    tracer = Tracer(clock)
506    llm = llm or ScriptedLLM(_support_policy)
507    messages: list[dict] = [{"role": "user", "content": question}]
508    with tracer.span("invoke_agent support-agent", "agent", **{"gen_ai.operation.name": "invoke_agent",
509                                                                "gen_ai.agent.name": "support-agent", "app.input": question}) as root:
510        for _ in range(10):
511            with tracer.span(f"chat {llm.model}", "llm", **{"gen_ai.operation.name": "chat", "gen_ai.request.model": llm.model,
512                                                            "app.prompt.version": prompt_version}) as sp:
513                reply = llm.complete(system="You are a support agent.", messages=messages, tools=TOOLS)
514                clock.advance(LLM_MS)  # stands in for the model's response time
515                sp.set("gen_ai.response.model", reply.model)
516                sp.set("gen_ai.usage.input_tokens", reply.usage.input_tokens)
517                sp.set("gen_ai.usage.output_tokens", reply.usage.output_tokens)
518                sp.set("gen_ai.response.finish_reasons", [reply.stop_reason])
519                sp.set("app.cost_usd", (reply.usage.input_tokens * PRICE_IN_PER_M + reply.usage.output_tokens * PRICE_OUT_PER_M) / 1e6)
520            messages.append({"role": "assistant", "content": reply.assistant_content})
521            if reply.stop_reason != "tool_use":
522                root.set("app.output", reply.text)
523                break
524            results = []
525            for call in reply.tool_calls:
526                with tracer.span(f"execute_tool {call.name}", "tool", **{"gen_ai.operation.name": "execute_tool",
527                                                                         "gen_ai.tool.name": call.name, "gen_ai.tool.call.id": call.id,
528                                                                         "app.tool.arguments": call.input}) as sp:
529                    clock.advance(TOOL_MS)
530                    oid = call.input["order_id"]
531                    if oid in ORDERS:
532                        results.append(tool_result_block(call.id, ORDERS[oid]))
533                    else:
534                        sp.fail(f"unknown order id {oid}")
535                        results.append(tool_result_block(call.id, f"unknown order id {oid}", is_error=True))
536            messages.append({"role": "user", "content": results})
537    return tracer
Run a small support agent with every step recorded. Returns the tracer.
545def trace_totals(root: Span) -> dict[str, Any]:
546    spans = list(walk(root))
547    llm = [s for s in spans if s.kind == "llm"]
548    return {
549        "duration_ms": root.duration_ms,
550        "llm_calls": len(llm),
551        "tool_calls": sum(s.kind == "tool" for s in spans),
552        "input_tokens": sum(s.attributes.get("gen_ai.usage.input_tokens", 0) for s in llm),
553        "output_tokens": sum(s.attributes.get("gen_ai.usage.output_tokens", 0) for s in llm),
554        "cost_usd": sum(s.attributes.get("app.cost_usd", 0.0) for s in llm),
555        "errors": sum(s.status == "error" for s in spans),
556    }
559def first_error(root: Span) -> Span | None:
560    """The earliest span (in time order) that failed, or None."""
561    return next((s for s in walk(root) if s.status == "error"), None)
The earliest span (in time order) that failed, or None.
573def render(root: Span, prefix: str = "") -> str:
574    """Draw the span tree with box-drawing branches."""
575    lines = [_line(root)] if not prefix else []
576
577    def rec(span: Span, indent: str) -> None:
578        for i, c in enumerate(span.children):
579            last = i == len(span.children) - 1
580            lines.append(f"{indent}{'└─' if last else '├─'} {_line(c)}")
581            rec(c, indent + ("   " if last else "│  "))
582
583    rec(root, prefix)
584    return "\n".join(lines)
Draw the span tree with box-drawing branches.
587def to_otel(tracer: Tracer) -> list[dict[str, Any]]:
588    """OTLP-shaped span records (times in Unix nanoseconds)."""
589    out = []
590    for s in walk(tracer.root):
591        out.append({
592            "traceId": tracer.trace_id,
593            "spanId": s.span_id,
594            "parentSpanId": s.parent_id or "",
595            "name": s.name,
596            "startTimeUnixNano": int(s.start_ms * 1_000_000),
597            "endTimeUnixNano": int((s.end_ms or s.start_ms) * 1_000_000),
598            "attributes": dict(s.attributes),
599            "status": {"code": "ERROR" if s.status == "error" else "OK", "message": s.error or ""},
600        })
601    return out
OTLP-shaped span records (times in Unix nanoseconds).
604def golden_case_from_trace(tracer: Tracer, feedback: str) -> dict[str, Any]:
605    """Turn a flagged trace into a test case for the golden set."""
606    err = first_error(tracer.root)
607    return {
608        "id": f"prod-{tracer.trace_id}",
609        "input": tracer.root.attributes.get("app.input"),
610        "observed_output": tracer.root.attributes.get("app.output"),
611        "observed_error": err.error if err else None,
612        "feedback": feedback,
613    }
Turn a flagged trace into a test case for the golden set.
621def figures() -> dict[str, Any]:
622    import matplotlib
623
624    matplotlib.use("Agg")
625    import matplotlib.pyplot as plt
626
627    figs: dict[str, Any] = {}
628    colors = {"agent": "#8c8c8c", "llm": "#4c72b0", "tool": "#dd8452"}
629
630    t = run_traced_agent("Where are orders A100, A200 and A300?")
631    spans = list(walk(t.root))
632    fig, ax = plt.subplots(figsize=(7.5, 3.6))
633    for row, s in enumerate(spans):
634        ax.barh(row, s.duration_ms, left=s.start_ms, color=colors[s.kind])
635        ax.text(s.start_ms + 5, row, s.name.replace("scripted-large", "model"), va="center", fontsize=7, color="white" if s.kind != "agent" else "black")
636    ax.invert_yaxis()
637    ax.set_yticks([])
638    ax.set_xlabel("milliseconds since the task started")
639    ax.set_title("Trace waterfall: model calls (blue) and tool calls (orange)")
640    fig.tight_layout()
641    figs["waterfall"] = fig
642
643    t6 = run_traced_agent("Where are orders A100, A200, A300, A400, A500 and A600?")
644    llm = [s for s in walk(t6.root) if s.kind == "llm"]
645    fig, ax = plt.subplots(figsize=(6.5, 3.4))
646    ax.bar(range(1, len(llm) + 1), [s.attributes["gen_ai.usage.input_tokens"] for s in llm], color="#4c72b0", label="input")
647    ax.bar(range(1, len(llm) + 1), [s.attributes["gen_ai.usage.output_tokens"] for s in llm],
648           bottom=[s.attributes["gen_ai.usage.input_tokens"] for s in llm], color="#dd8452", label="output")
649    ax.set_xlabel("model call number within one run")
650    ax.set_ylabel("tokens")
651    ax.set_title("Each call resends the growing conversation")
652    ax.legend()
653    fig.tight_layout()
654    figs["tokens"] = fig
655
656    by_kind = {"model calls": sum(s.duration_ms for s in walk(t6.root) if s.kind == "llm"),
657               "tool calls": sum(s.duration_ms for s in walk(t6.root) if s.kind == "tool")}
658    fig, ax = plt.subplots(figsize=(5.5, 3))
659    ax.barh(list(by_kind), list(by_kind.values()), color=["#4c72b0", "#dd8452"])
660    for i, v in enumerate(by_kind.values()):
661        ax.text(v, i, f" {v:.0f} ms", va="center")
662    ax.set_xlabel("total milliseconds in the six-order run")
663    ax.set_xlim(0, max(by_kind.values()) * 1.2)
664    ax.set_title("Where the time goes")
665    fig.tight_layout()
666    figs["latency"] = fig
667    return figs
670def demo() -> None:
671    banner("1. A traced run")
672    ok = run_traced_agent("Where is order A100?")
673    print(render(ok.root))
674    print()
675    table(["total", "value"], list(trace_totals(ok.root).items()), floatfmt=".6f")
676
677    banner("2. Debugging a failure from its trace")
678    bad = run_traced_agent("Where is order A-100?")
679    print(render(bad.root))
680    print()
681    err = first_error(bad.root)
682    print(f"first error: {err.name}: {err.error}  (arguments {err.attributes['app.tool.arguments']})")
683    print(f"agent said: {bad.root.attributes['app.output']!r}")
684    print()
685    say("""The model passed the id exactly as typed and the tool doesn't normalize
686        hyphens. The fix belongs in the tool, and the trace is what tells you so.""")
687
688    banner("3. OpenTelemetry-shaped export (first two spans)")
689    for s in to_otel(ok)[:2]:
690        print({k: s[k] for k in ("traceId", "spanId", "parentSpanId", "name", "startTimeUnixNano", "endTimeUnixNano")})
691    print()
692
693    banner("4. Feedback closes the loop")
694    print(golden_case_from_trace(bad, feedback="thumbs_down"))
695    print()
696    takeaway("Record every step with standard attribute names; debug from the trace; turn flagged traces into golden tests.")